Predicts.guru vs Robin Markets
Predicts.guru and Robin Markets are both filed under Platforms & Tools and Market Making. Both are trading platforms; Predicts.guru is free, Robin Markets is priced on its own site. Below: the facts side by side, where the two actually differ, and when each one is the better pick.
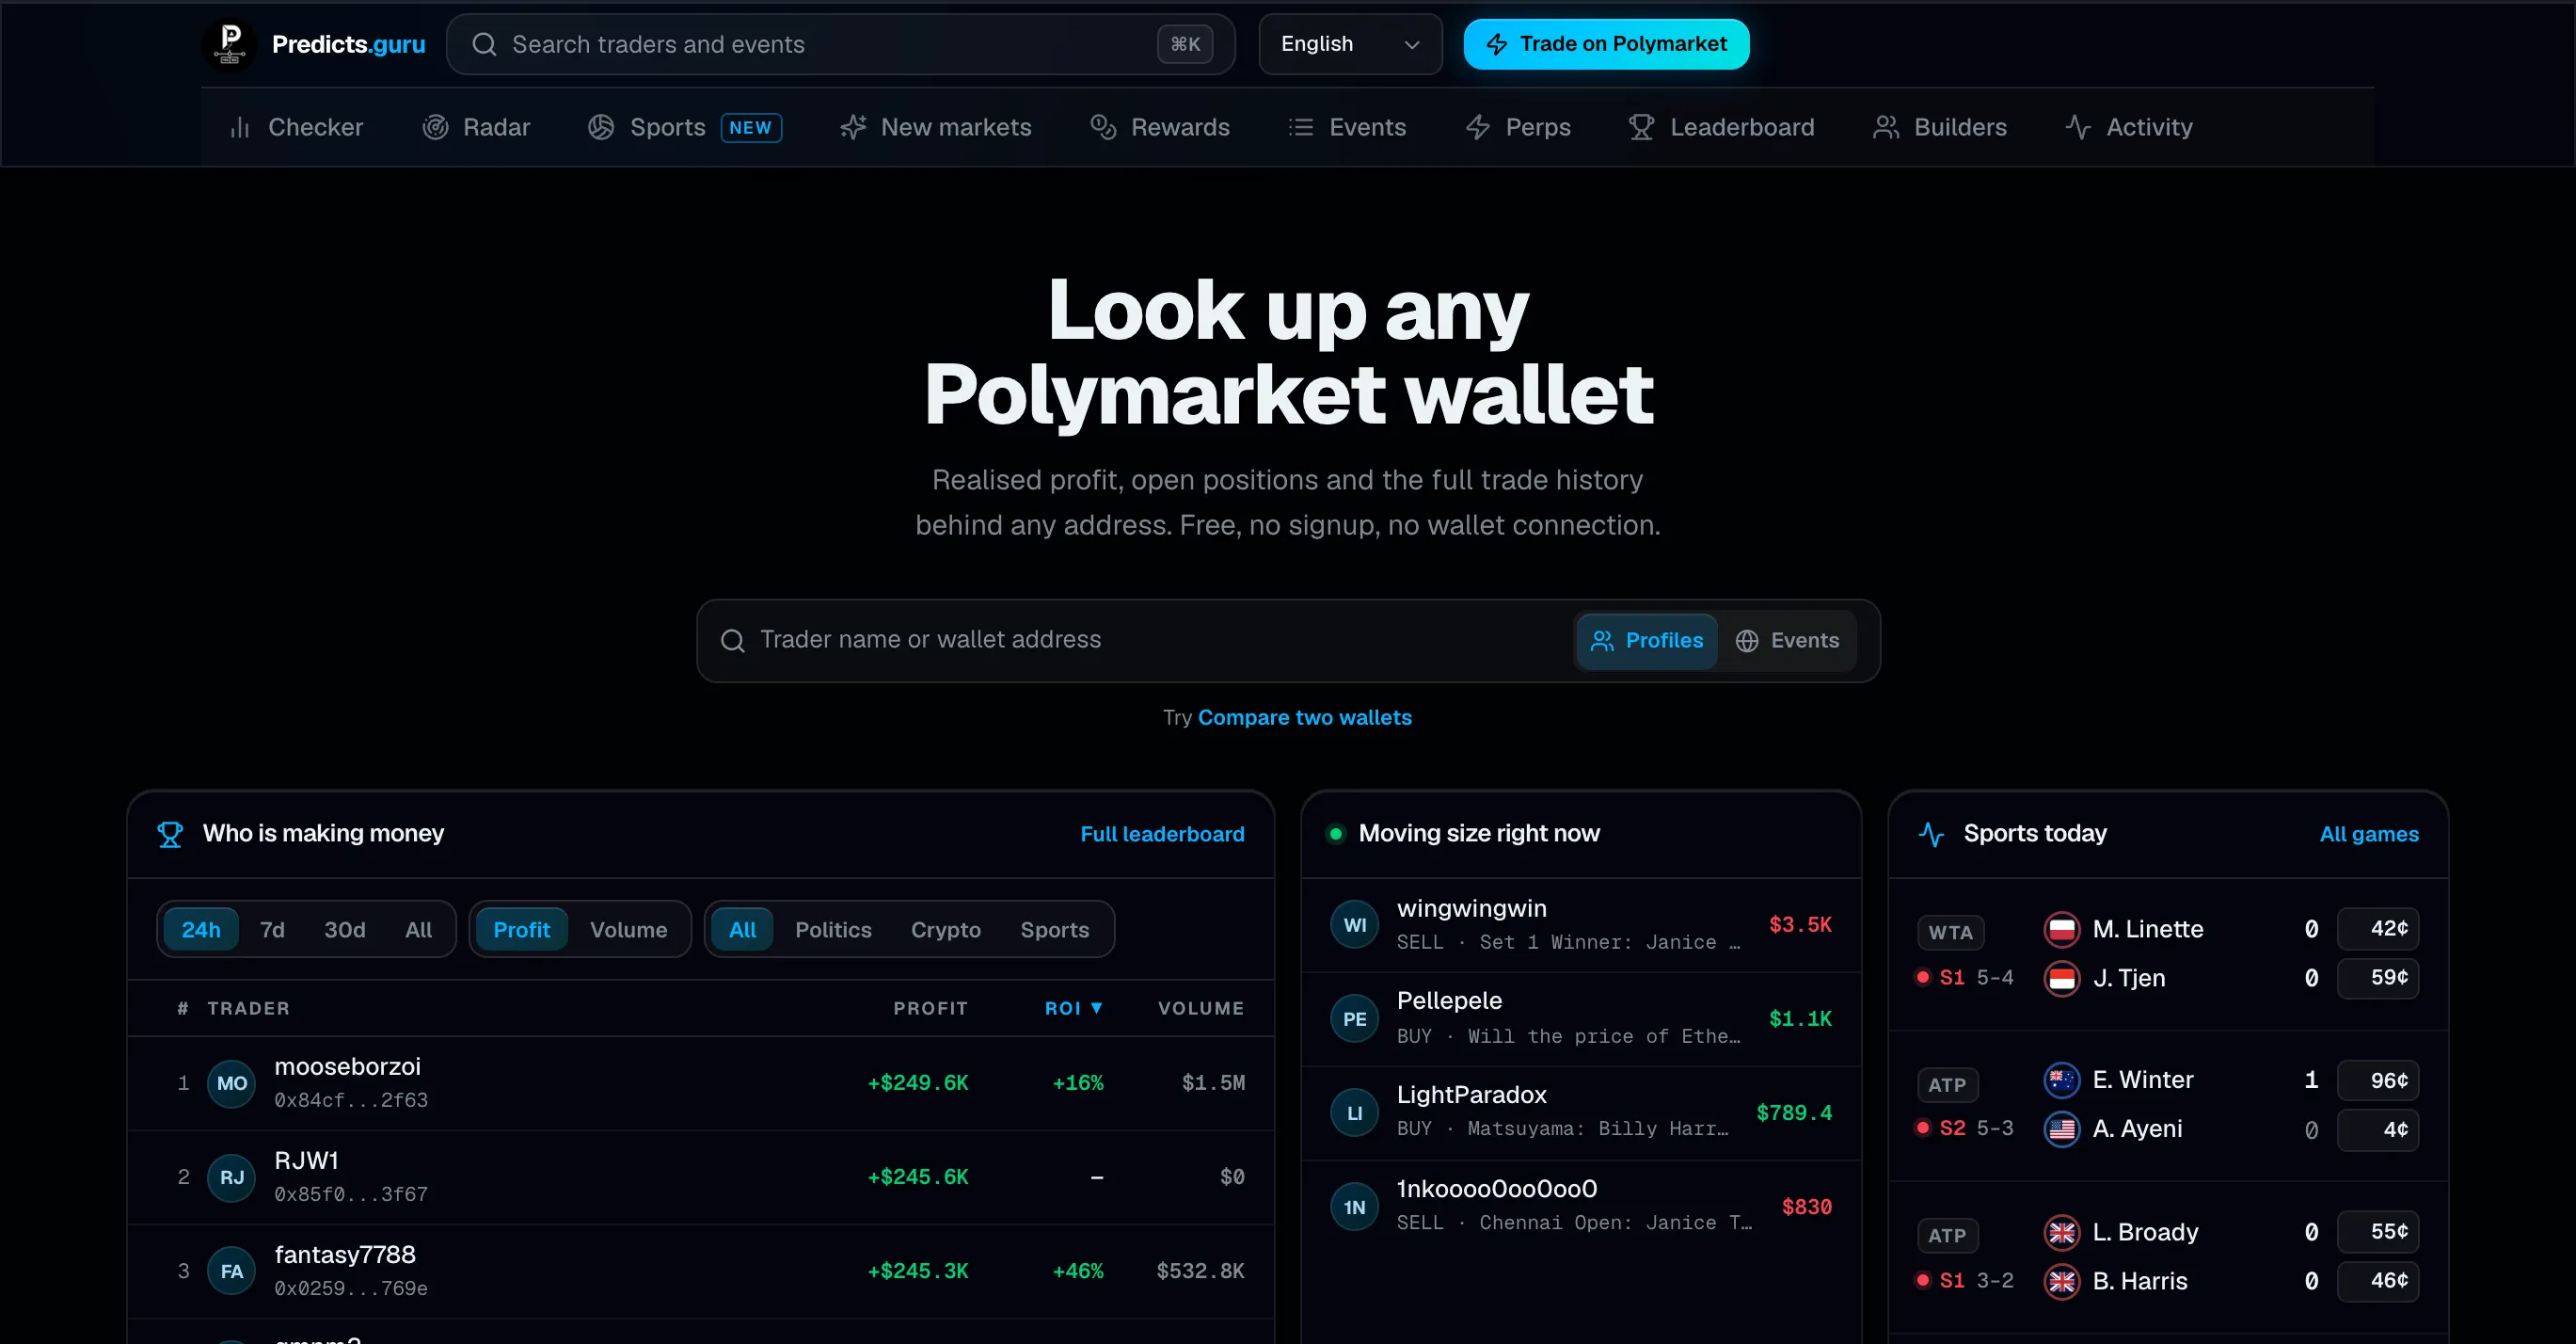
Free Polymarket analytics site built around a wallet checker.
Compared with Robin Markets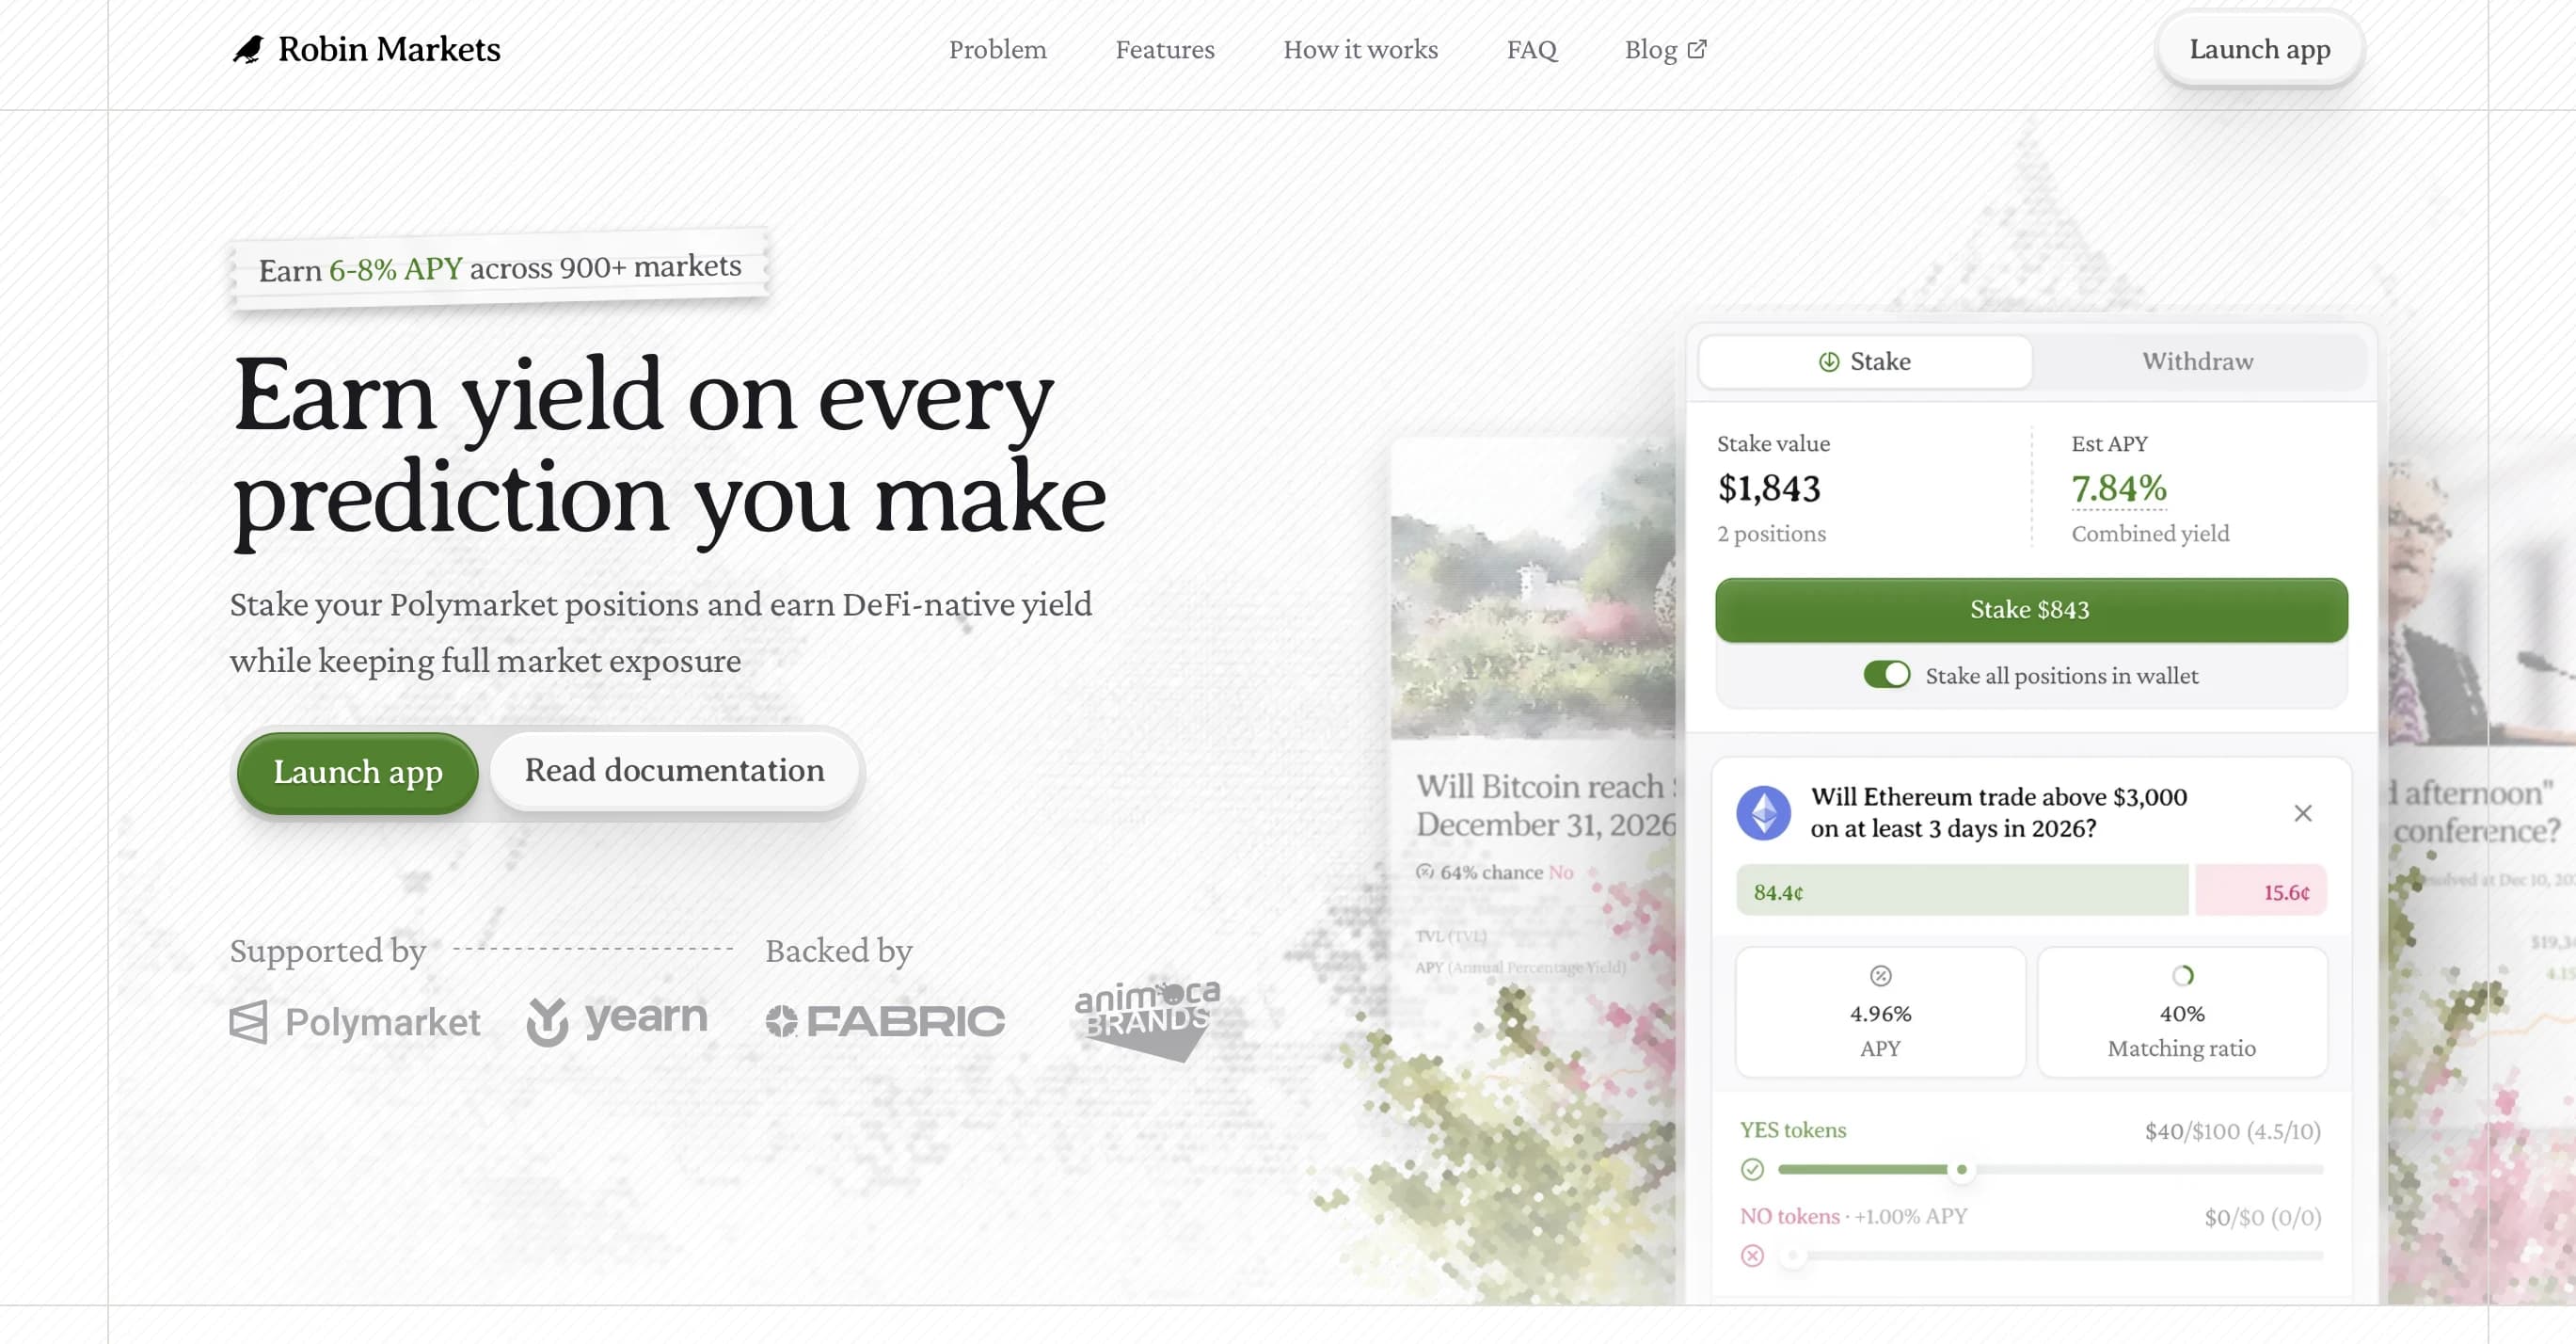
DeFi yield layer for Polymarket positions.
Compared with Predicts.guruAt a glance
| Fact | Predicts.guru | Robin Markets |
|---|---|---|
| Type | Trading platform | Trading platform |
| Category | Platforms & Tools | Platforms & Tools |
| Also listed in | Sports Trading, Market Making, Copy Trading, Sniping | Market Making, Hedging |
| Pricing | Free | Pricing on site |
| Price | free | 6%+ APY |
| Risk rating | Medium risk | Medium risk |
| Markets | All Polymarket markets, plus Polymarket Perps | Polymarket and DeFi yield |
| Source | Source not published | Source not published |
| Runs in Telegram | No | No |
| Listed since | Nov 9, 2026 | Jul 3, 2026 |
Highlighted rows differ
Key differences
- Predicts.guru is free (free); Robin Markets is priced on its own site.
- They cover different markets: Predicts.guru lists All Polymarket markets, plus Polymarket Perps, Robin Markets lists Polymarket and DeFi yield.
- Only Predicts.guru is filed under Sports Trading and Copy Trading and 1 more, and only Robin Markets is filed under Hedging.
- Robin Markets has been listed since Jul 3, 2026; Predicts.guru joined on Nov 9, 2026.
Choose Predicts.guru if…
- you want to start without paying
- you trade All Polymarket markets, plus Polymarket Perps
- your focus is Sports Trading and Copy Trading and 1 more
Choose Robin Markets if…
- you trade Polymarket and DeFi yield
- your focus is Hedging
What Predicts.guru does
Free Polymarket analytics site built around a wallet checker. Paste an address or a username and it shows profit, open and closed positions, win rate, fees and the full trade history, with a P&L chart over time. Around it sit leaderboards, a radar for unusual buying, event and holder pages, a screener for new and closing markets, a liquidity-rewards scanner, a ranking of the apps that route orders into Polymarket, sports and Perps pages, and a tool that turns a wallet's P&L into a short video. There is no sign-up, no payment and no wallet connection; you trade on Polymarket yourself.
Features- Wallet report for any address or username: total and trading P&L, fees, maker and taker results, positions, trade history and a P&L timeline
- Compare up to ten wallets side by side, and a bulk checker
- Leaderboards for 24 hours, 7 days, 30 days and all time, by profit or volume, with sports leaderboards per league
- Radar: recent buys scored 0–100 for size, fresh wallets, wallet record and markets where notable wallets buy the same side
- Event pages with holders, flow and price history; feeds of new and closing markets
- The data is Polymarket's own, presented more fully. On Nov 9, 2026 the top five of the home page's 24-hour leaderboard matched Polymarket's daily profit leaderboard exactly, name for name and to the hundred dollars. The wallet pages draw on the same source, and the all-time rank we checked, #3,262,473, was Polymarket's figure too. What the site adds is the arrangement: positions, fees and history on one page, and comparisons Polymarket does not offer.
- That arrangement is also where a careful reader should slow down. The 24-hour leader, mooseborzoi, showed +$249.6K for the day; its wallet page put the account at about −$9.4 million of trading P&L, −$13.5 million of total profit after $2.5 million of fees, and −$9.7 million in the page title, while a “Realized” tile read +$107,592 because only 440 of its 48,785 positions were loaded. Each number measures something different, and the Trade line, −$11.89 million, matched Polymarket's all-time figure. But a day's leaderboard says little about a trader, and the site's own wallet page is the best demonstration of that.
- The Builders section is the part most relevant to this catalog. It ranks every app that routes orders through Polymarket by the volume credited to its builder code, and it says plainly that the fee column is each builder's own published rate, which it does not verify, and that an empty cell means nothing was published. The radar score is described as an investigation priority and not a forecast or proof of inside information, which is the right way to read it.
What Robin Markets does
DeFi yield layer for Polymarket positions. Stake your YES/NO tokens and earn a guaranteed 6%+ APY while keeping full market exposure — Robin pairs opposite sides into delta-neutral positions, claims the collateral and routes USDC into DeFi lending across 900+ markets.
Features- Stake Polymarket positions and earn yield
- Guaranteed 6% APY minimum
- +1% APY for balancing scarce market sides
- Keep full market exposure while staked
- On-chain and verifiable across 900+ markets
- Pairs YES and NO tokens from different users into delta-neutral positions.
- Claims the underlying USDC collateral from those paired positions.
- Routes the collateral into DeFi lending protocols to generate yield.
More head-to-heads
Every fact on this page is taken from the two listings as their authors publish them; POLBOTS verifies neither performance nor claims and has no stake in either tool. Nothing here is financial advice.