On this page8 sections
The short answer
Every app that sends orders to Polymarket can register as a builder and tag its orders with a code. Polymarket publishes the daily volume and active users behind every code. That gives a census of the whole third-party ecosystem — bots, terminals, wallets, Telegram tools — going back to October 10, 2025. We pulled all of it, up to October 19, 2026.
- 592 apps routed a trade in that year, and 268 of them are dead: no volume in the last 30 days.
- Most of the living are barely alive. Of the 324 with any volume, 145 moved less than $10,000 in 30 days. Only 179 apps moved more.
- The dead didn't last long. The median one traded for 62 days from its first fill to its last, and one in ten was gone within a week.
- Volume grew for nine months, then halved. It rose from $138M in November to $1.50B in June, then fell to $684M in September.
- The market is concentrated. One app, Betmoar, carries 16.9% of everything, and the top ten carry 63%.
- We cleaned up our own catalog. Four of our listings pointed at sites that no longer resolve, and we removed them today.
A year in volume
| Month | Builder volume | Apps with volume | Avg daily users |
|---|---|---|---|
| Oct 2025 (from the 10th) | $32M | 11 | 91 |
| Nov 2025 | $138M | 42 | 791 |
| Dec 2025 | $227M | 108 | 1,660 |
| Jan 2026 | $393M | 157 | 3,181 |
| Feb 2026 | $475M | 205 | 4,458 |
| Mar 2026 | $612M | 254 | 5,528 |
| Apr 2026 | $796M | 287 | 6,639 |
| May 2026 | $741M | 267 | 5,293 |
| Jun 2026 | $1,500M | 309 | 9,338 |
| Jul 2026 | $1,403M | 340 | 10,776 |
| Aug 2026 | $689M | 321 | 7,464 |
| Sep 2026 | $684M | 330 | 6,785 |
| Oct 2026 (to the 19th) | $473M | 293 | 7,083 |
The summer peak lines up with the World Cup knockout rounds. The busiest day of the year was July 7: $114M and 17,768 users summed across apps. Twelve apps — among them Polymtrade, MetaMask, Predict and Portex — had their single busiest day on July 19, the day of the final.
The hangover was immediate. August volume was less than half of July's, and it has not come back. The number of apps kept rising through the drop, though: more apps are now splitting a smaller pie than in the spring.
Half of everything launched is dead
We call an app dead if it had no volume in the 30 days to October 19, and barely alive if it had some but under $10,000.
| Status | Apps | Share |
|---|---|---|
| Moved $10,000+ in 30 days | 179 | 30% |
| Under $10,000 in 30 days | 145 | 24% |
| No volume in 30 days | 268 | 45% |
Many dead codes were tests, side projects or launches that never found a user. To separate those from real products, we also looked only at apps that reached $100,000 of lifetime volume or ten users in a single day. There are 324 of those, and 93 of them are dead: 29%.
How long the dead ones lasted
- All 268: a median of 62 days between the first trade and the last. 10% were gone within a week and 28% within a month.
- The 93 that had traction: a median of 97 days, with trades on 65 separate days.
The typical arc is a launch, a few weeks of users, and then a slow fade rather than a clean shutdown. The site often stays up long after the trades stop. That is why a bot's own website is the last place to find out whether anyone still uses it.
Survival by launch month
How many apps from each launch month still had volume in the last 30 days:
| Launched | Apps | Still trading | Real products still trading |
|---|---|---|---|
| Nov 2025 | 32 | 17 (53%) | 17 of 25 |
| Dec 2025 | 65 | 21 (32%) | 21 of 39 |
| Jan 2026 | 56 | 29 (52%) | 26 of 38 |
| Feb 2026 | 69 | 23 (33%) | 20 of 38 |
| Mar 2026 | 69 | 27 (39%) | 20 of 32 |
| Apr 2026 | 64 | 32 (50%) | 27 of 36 |
| May 2026 | 52 | 37 (71%) | 27 of 30 |
| Jun 2026 | 55 | 37 (67%) | 25 of 34 |
| Jul 2026 | 57 | 40 (70%) | 23 of 24 |
Half to two-thirds of last winter's launches are gone. The summer cohorts look healthier mainly because they are younger; if the older cohorts are a guide, many of them will not last the winter.
The ones that collapsed
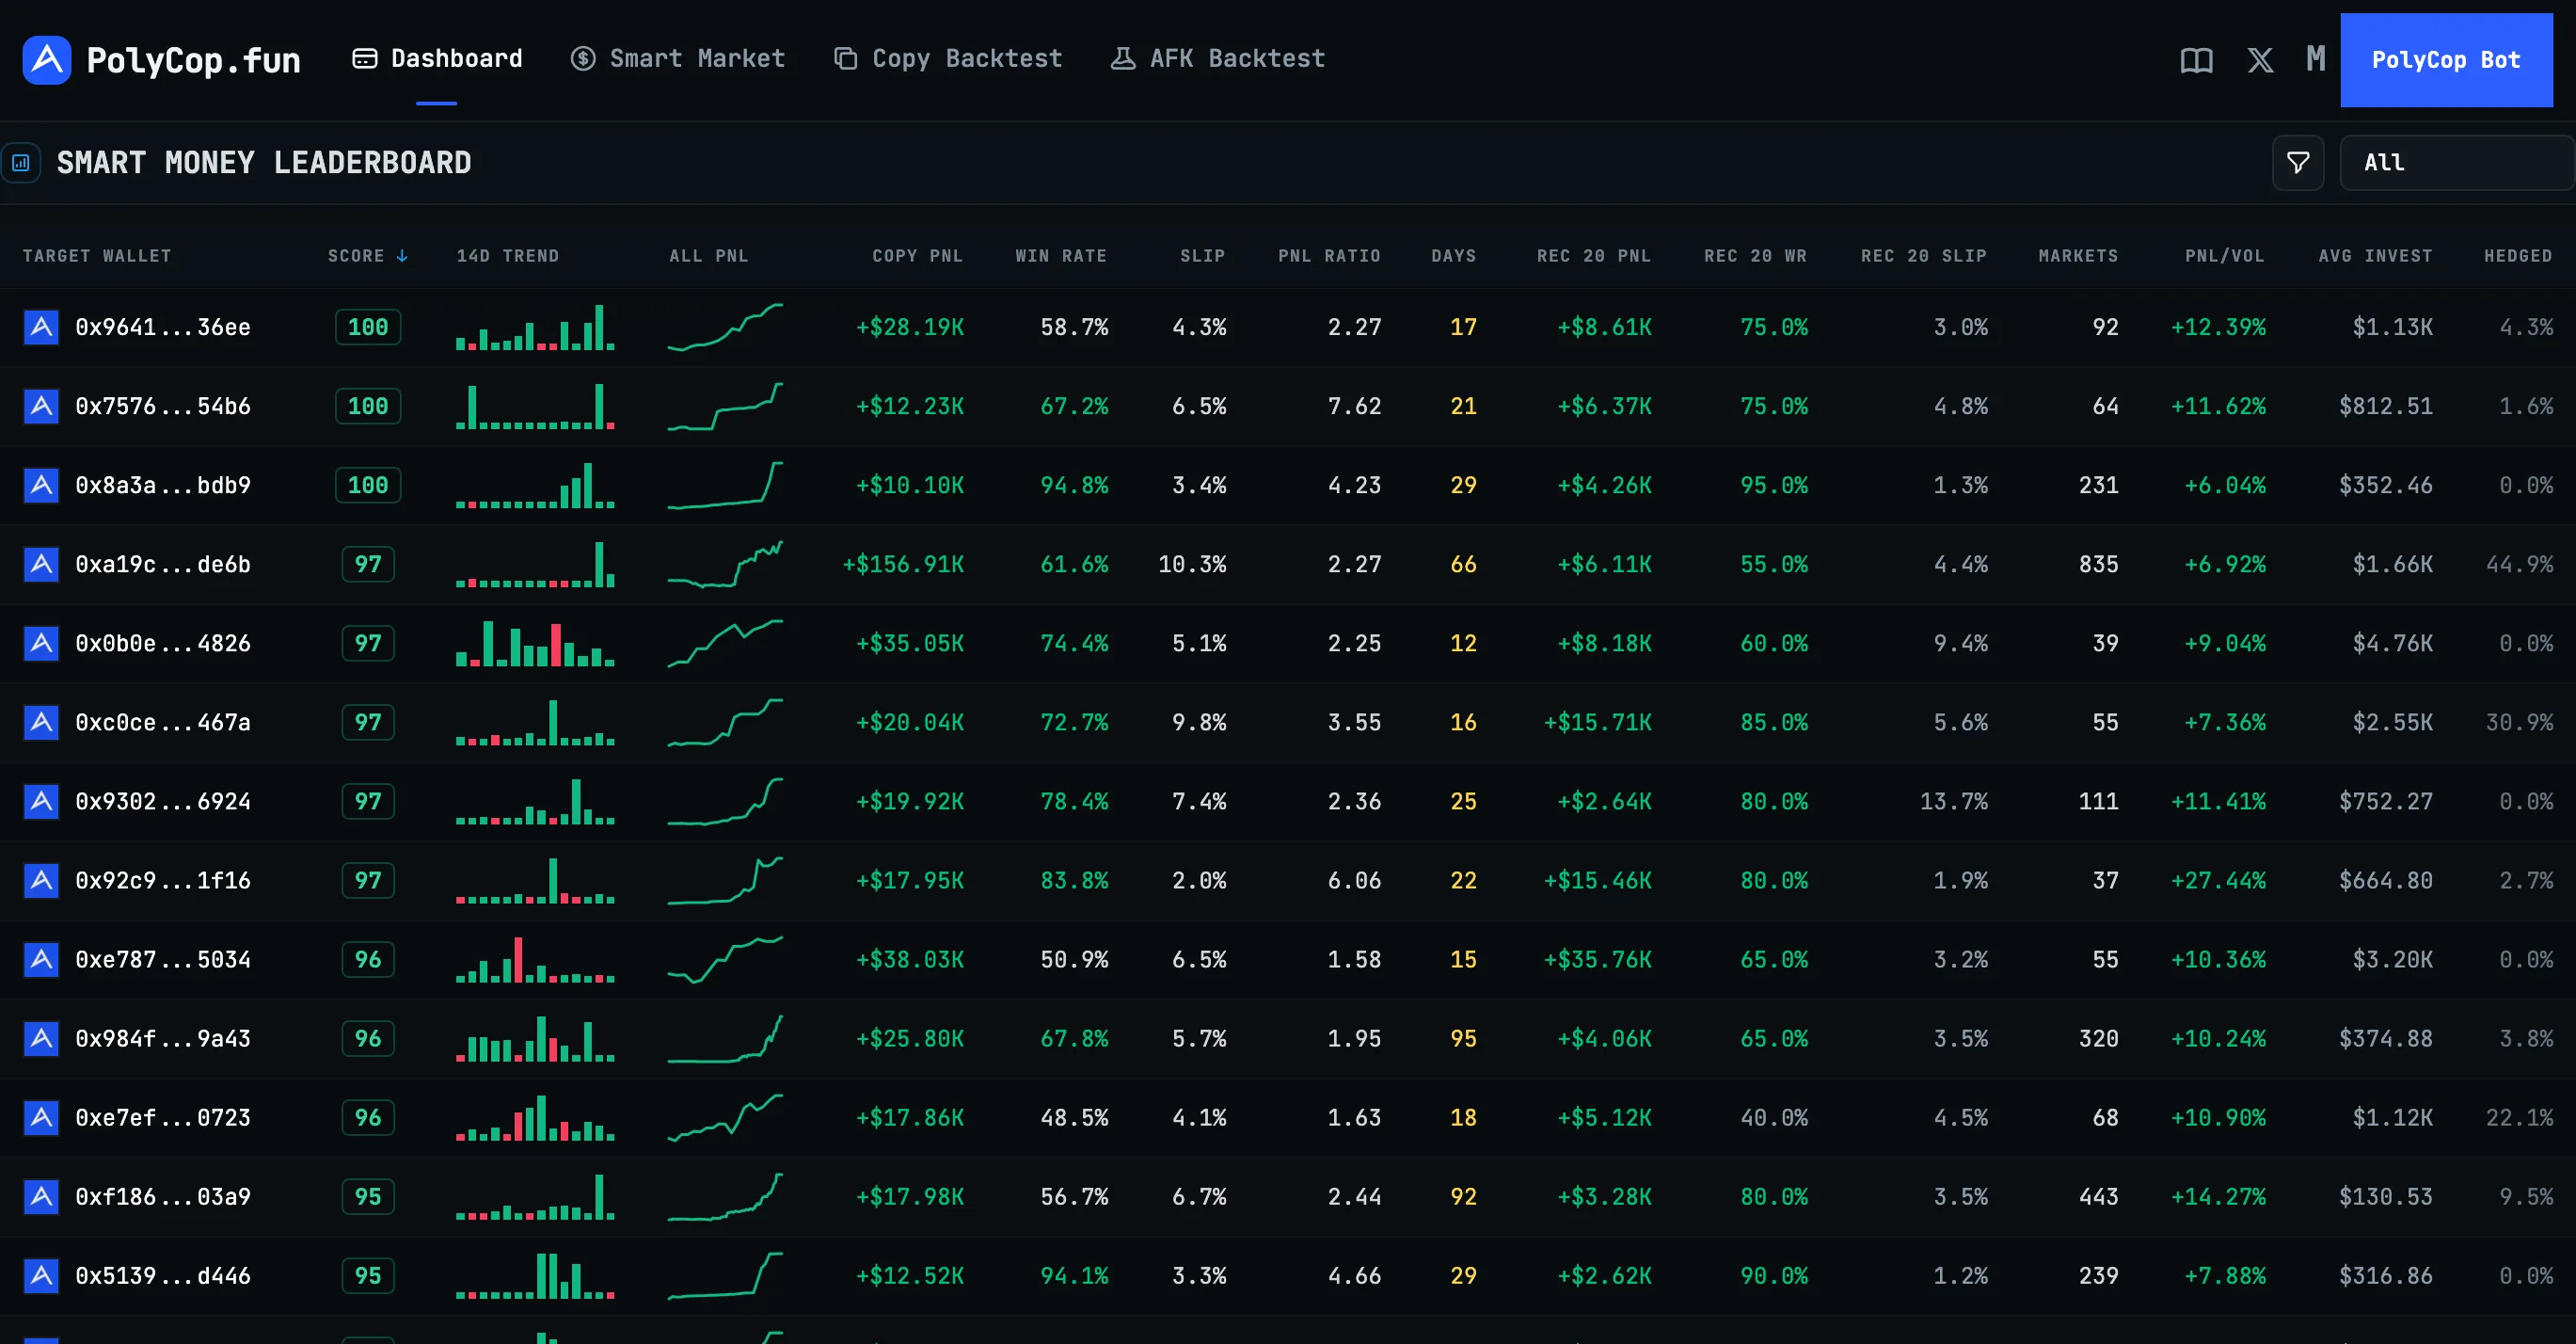
53 apps have had at least one month above $5 million. Only one of them is fully dead: Polyzard, which stopped trading on May 15. But 17 are now more than 90% below their best month:
| App | Best month | Last 30 days | Peak daily users |
|---|---|---|---|
| PolyHelper.io | $158.8M (Jun) | $14.1M | 105 |
| WagerUpPilot | $67.5M (Apr) | $0.12M | 76 |
| Polygun | $35.0M (Mar) | $1.96M | 1,058 |
| Kreo | $25.5M (Apr) | $2.42M | 706 |
| Bullpen | $17.9M (Apr) | $0.90M | 267 |
| Stan | $16.1M (Jul) | $0.06M | 1,825 |
| Polycule | $13.6M (Dec) | $0.01M | 314 |
| Portex | $9.7M (Jul) | $0.57M | 769 |
| OVERDOG | $5.3M (Jul) | $0.30M | 50 |
Some of the falls have a known cause. Polycule was hacked in January. Most don't, and look like the arc above: users came for a strategy, a promotion or a season, and left when it ended.
Two caveats. A collapse in one code can hide a move to a new code; Almanac, for example, runs two. And the busiest Telegram bots of the spring — Polygun, Kreo — are still alive, just a fraction of their peak.
The winners
The money has consolidated around a handful of apps:
| App | Last 30 days | Share |
|---|---|---|
| Betmoar | $119.1M | 16.9% |
| Traderline | $75.2M | 10.7% |
| Gate | $60.1M | 8.5% |
| SpreadCore.xyz | $38.1M | 5.4% |
| Sharktool | $37.9M | 5.4% |
| MagicMarkets | $33.5M | 4.8% |
| Polymtrade | $29.9M | 4.3% |
| Orbeflow | $19.5M | 2.8% |
| NoArb | $15.9M | 2.3% |
| Jupiter | $15.3M | 2.2% |
The top five carry 47% of the volume, the top ten 63% and the top twenty 80%. The other 300-odd living apps share the remaining fifth.
The leaders are a mix:
- terminals for active traders: Betmoar, Traderline, Polymtrade;
- an exchange and a Solana trading app: Gate and Jupiter;
- apps whose volume comes from a few very large accounts rather than many users. Gate moved $60.1M in 30 days with an average of three users a day, never more than six.
The leaders are mostly not "bots" in the set-and-forget sense. They are the tools people trade through. What fees they charge is a separate story; we checked every builder code on-chain.
Our own catalog
A catalog that lists dead products is part of the problem, so we ran the same check on ourselves.
Websites. We requested all 128 listings on October 20:
- Four sites no longer resolve at all, so we removed those listings today: Polylayer (polylayer.xyz), Probably (probably.gg), Betly (betly.trade, whose registration expired on August 26) and Polytale (polytale.live). All four joined the catalog on July 3, among its earliest entries.
- Six more sites failed to load, from our network and from an outside one. We are rechecking them before acting, because an outage is not a shutdown.
- The rest answered. A few only after a bot check.
Volume. Of the 42 listings we can tie to a builder code:
- 28 moved at least $10,000 in the last 30 days;
- 7 moved less;
- 7 routed nothing.
For most of the quiet ones, trading is a side feature of an analytics tool rather than the product itself.
What this means if you are choosing a bot
- Check the volume before the website. A builder's daily volume and users are public. A site can stay polished for months after its last trade; the data cannot.
- Prefer apps that survived a downturn. The August drop sorted apps that kept users from apps that rented them for a season. Survival through a quiet month says more than a launch spike.
- Expect churn. With roughly half of each cohort gone within a year, plan for the tool you use today to disappear. Keep your funds in a wallet you control, and keep your strategy in a form you could move.
Method
- Source. Polymarket's public builder data: daily volume and active users per builder code, from October 10, 2025 (where the series begins) to October 19, 2026, the last complete day. October 20 is excluded as partial.
- Dead. No volume in the 30 days from September 20 to October 19.
- Real product. At least $100,000 of lifetime volume, or ten active users on some day.
- Lifespan. Days from the first to the last day with volume. Apps already trading on October 10, 2025 have their start cut off by the series; only two were.
- Catalog check. An HTTP request to each listing's site from two networks on October 20, plus DNS and registry records for the ones that failed.
Frequently asked questions
- How many Polymarket bots are there?
- 592 apps have routed at least one trade through Polymarket's builder program since October 10, 2025. That counts bots, trading terminals, wallets and Telegram tools. By October 19, 2026, 324 of them had any volume in the previous 30 days, and only 179 had moved more than $10,000 in that time. The rest are dead or close to it.
- How long does a Polymarket bot last?
- Of the 268 apps with no volume in the last 30 days, the median one lasted 62 days from its first trade to its last. One in ten was gone within a week. Apps that got real traction before dying — $100,000 of volume or ten users in a day — lasted longer: a median of 97 days.
- Which Polymarket apps have the most volume?
- In the 30 days to October 19, 2026: Betmoar ($119.1M), Traderline ($75.2M), Gate ($60.1M), SpreadCore ($38.1M), Sharktool ($37.9M), MagicMarkets ($33.5M) and Polymtrade ($29.9M). Betmoar alone carries 16.9% of all builder volume, and the top ten together 63.2%.
- Is Polymarket bot volume growing?
- It grew for nine months and then halved. Builder volume went from $138M in November 2025 to a peak of $1.50 billion in June 2026, then fell to $689M in August and $684M in September. The June–July peak coincides with the World Cup knockout rounds. October is running slightly above the September rate.
- Did POLBOTS remove dead bots from its catalog?
- Yes. On October 20, 2026 we removed four listings whose sites no longer resolve: Polylayer, Probably, Betly and Polytale. Six more sites failed to load that day from two separate networks. We are rechecking those before deciding, because an outage is not a shutdown.