On this page12 sections
- The short answer
- Why we froze the list
- What happened to the 30-day top 100
- The same thing on two other lists
- Who keeps winning
- Does more past profit mean more future profit?
- The all-time board is a record of the past
- Check the result against the leaderboard
- What this means for you
- How to check a wallet yourself
- What this test can't tell you
- Method
The short answer
A leaderboard shows who won: the top of a list where 41% of wallets made money last month. People use it to guess who will win next. So we tested that guess: we took the list of top wallets as it stood on a past date, and measured only what happened afterwards.
The test wallets are the 100 on Polymarket's 30-day profit board on October 11, 2026. We followed them for the next 24 days.
- About half kept winning. 50 made money, 38 lost money and 12 didn't trade at all.
- Most did worse than before. 73 of 100 made less than in the 24 days before listing, and the median wallet fell from $164K to $5K.
- Rank told us almost nothing. The rank correlation between past and next profit was 0.02.
- A few wallets carried the group. Five made $12.07M of the $12.95M net.
- Fast bots held up. Human-paced wallets didn't. 38 of 47 fast wallets made money, against 42 of 84 human-paced ones, and the fast group is the one you can't copy.
Why we froze the list
The easy version of this test gives a clean, wrong answer. Take today's top wallets and compare their last two periods. We did. Among wallets that were up in the 90 days ending a month ago, 217 of 276 made money in the last 30 days: 79%. Among those that were down, 64 of 81 did: also 79%.
It looks as if the past means nothing and nearly everyone wins. Neither part holds. Today's list includes the 30-day board, so a wallet with a bad quarter is on it because of a great last month. The outcome was used to pick the sample.
The fix is to choose the wallets first and look later. We started tracking on October 11, and every day's list is saved. So for each wallet we know when we first saw it on a board. Everything before the next midnight UTC is the past. Everything after is the test. Nothing that happened after that date could have put a wallet in its group.
What happened to the 30-day top 100
The 100 wallets had made $25.98M in the 24 days before October 12. In the 24 days after, they made $12.95M.
| Group | Wallets | Made money | Lost money | Didn't trade | Next 24 days |
|---|---|---|---|---|---|
| Ranks 1–10 | 10 | 5 | 4 | 1 | $10.03M |
| Ranks 11–50 | 40 | 22 | 13 | 5 | $0.53M |
| Ranks 51–100 | 50 | 23 | 21 | 6 | $2.39M |
| All 100 | 100 | 50 | 38 | 12 | $12.95M |
The top 10 look strong in dollars, but three wallets made almost all of it:
| Rank on Oct 11 | Wallet | Kind | Past 30 days | Next 24 days |
|---|---|---|---|---|
| 1 | 00gringo00 | human-paced | $1.74M | $0 |
| 2 | e46m3 | fast | $267K | −$4K |
| 3 | breakthebank | market maker | $1.85M | $3.62M |
| 4 | kch-temp | human-paced | $1.64M | −$680K |
| 5 | UpTheBlues | fast | $1.82M | $2.15M |
| 6 | joseph00677 | human-paced | $389K | $4.03M |
| 7 | thereturnofdarthmaul | human-paced | $1.83M | $516K |
| 8 | papeasy | market maker | $1K | −$1K |
| 9 | 3edmond-dantes | human-paced | $502K | −$564K |
| 10 | HomeRunHazard | market maker | $1.02M | $964K |
The rank comes from Polymarket's board and the past 30 days from the PnL series, and the two can differ. That is why #8 shows $1K. We come back to this below.
Across all 100, gains came to $20.70M and losses to $7.75M. Five wallets made $12.07M, which is 93% of the net. The biggest falls were mooseborzoii, #12, at −$1.59M after making $659K, and kch-temp at −$680K.
Rank didn't help
Among the 88 wallets that kept trading, the Spearman rank correlation between past 30-day profit and the next 24 days was 0.02, with a 95% interval of −0.21 to 0.25. A wallet ranked 90th was about as likely to make money as one ranked 9th. The board sorts wallets well by what they have done, and it gave no useful order for what they did next.
This doesn't mean all the wallets are the same. It means that once you are inside the top 100, the order is mostly noise.
The same thing on two other lists
One list could be a fluke, so we ran the same test on the others.
| List | Wallets | Made money | Lost money | Didn't trade | Before | After | Did better after |
|---|---|---|---|---|---|---|---|
| 30-day top 100, Oct 11 | 100 | 50 | 38 | 12 | $25.98M | $12.95M | 27 |
| Crypto 30-day board, Oct 13 | 93 | 65 | 14 | 14 | $3.57M | $1.79M | 15 |
| First reached a board Oct 14–28 | 130 | 71 | 42 | 17 | $13.07M | $2.59M | 41 |
"Before" and "after" are windows of equal length for each wallet. The crypto list leaves out the wallets already seen on October 11. The third group had at least 7 days to run, with a median of 14.
The third row is the sharpest. These wallets had just reached a board, and they kept 20% of the pace that got them there. The median went from $36K to $3K. Reaching a board is often the top of a run, because a run is what gets a wallet onto it.
The crypto list did better than the others, with 65 of 93 making money. That fits the next section.
Who keeps winning
Here are the wallets from the October 11 and 13 lists that were active when listed, sorted by kind on the day we first saw them. Our rules for the kinds use maker share and pace.
| Kind | Wallets | Made money | Lost money | Didn't trade | Before | After |
|---|---|---|---|---|---|---|
| Fast | 47 | 38 | 6 | 3 | $3.82M | $2.73M |
| Market maker | 88 | 53 | 27 | 8 | $18.40M | $9.99M |
| Human-paced | 84 | 42 | 38 | 4 | $11.75M | $5.23M |
Fast wallets kept 71% of their pace, and 81% of them made money. That is what a small edge repeated thousands of times looks like. Our minute-markets guide explains the kind of trade behind many of them.
Market makers kept 54%. They earn from the spread, so most keep earning, but they carry inventory, and a bad game can cost a month. Rebates aren't in these numbers, and for market makers they matter.
Human-paced wallets were a coin flip. 42 up and 38 down. Their $5.23M looks healthy until you take out one wallet: without joseph00677 it is $1.20M.
This is the awkward part for anyone who follows wallets. The group that keeps winning is the one that can't be copied, because a copier arrives too late. The group you can follow at a human pace showed no sign of persistence in this window.
Does more past profit mean more future profit?
A little, at most. For the 204 active wallets on the October 11 and 13 lists that traded afterwards:
| Past window | Rank correlation with the next 22–24 days | 95% interval |
|---|---|---|
| 90 days | 0.14 | −0.02 to 0.31 |
| 30 days | 0.16 | 0.00 to 0.32 |
| 7 days | 0.23 | 0.07 to 0.39 |
All of these are weak. The most recent week was the best guide of the three, and it is the only one whose interval clearly stays above zero. Splitting the same wallets into quarters by past 90-day profit shows the shape:
| Past 90 days | Median past profit | Made money | Median next | Total next |
|---|---|---|---|---|
| Top quarter | $672K | 30 of 51 (59%) | $13K | $13.39M |
| Second | $236K | 37 of 51 (73%) | $36K | $3.34M |
| Third | $60K | 38 of 51 (75%) | $16K | $0.88M |
| Bottom quarter | $1K | 28 of 51 (55%) | $4K | $0.33M |
The biggest earners weren't the most likely to make money. They had the largest totals because they trade the largest size, and a few big wins account for it. If you want the wallet most likely to end a month ahead, the top of the board isn't where the data points.
Wallets that had been down don't tell us much. Only 24 active wallets were down over the 90 days before listing, and 14 of them made money afterwards, against 119 of 180 for those that were up. The gap could easily be chance.
The all-time board is a record of the past
The all-time top 100 of October 11 barely took part. 68 of the 100 didn't trade at all in the next 24 days, including 8 of the top 10. Of the 165 wallets on the October 11 and 13 lists that were already inactive when listed, only 21 traded again.
It is a list of what happened, including the 2024 election. Our copy-trading study found the same thing from another direction.
Check the result against the leaderboard
The PnL series isn't the leaderboard. The series is position profit before taker fees. The leaderboard is after fees, and neither includes rebates. The two can differ by a lot for one wallet: joseph00677 showed $1.58M on the board on October 11 and $389K in the series. We can't fully reconcile them, so we ran the test the other way too.
We took each wallet's 30-day leaderboard profit on October 11 and on November 4. Those windows overlap by six days, and 7 of the 100 no longer had a row. For the other 93:
| Measure | Oct 11 | Nov 4 |
|---|---|---|
| Total 30-day leaderboard profit | $42.72M | $35.35M |
| Median wallet | $274K | $106K |
| Did better than before | 23 of 93 | |
| Lost money | 22 of 93 |
The overlap flatters this table, because those six days were part of the run that put the wallets on the board. Even so the story holds: the median more than halved and about three in four did worse. The size of the total fall is less certain. It is about half in the series and 17% on the leaderboard, so don't quote "profit halves" as a rule.
Taker fees could turn a small win into a loss. Comparing the two sources for the last 30 days, 16 of the 280 wallets that were up in the series were down on the leaderboard, none of them fast wallets. That is too few to change the picture.
What this means for you
- If you pick wallets from the board: being on it is a weak signal, and the rank adds little. Look at what the wallet does, how many markets it trades and how long the record runs. Our wallet pages show that for each one.
- If you copy trades: expect regression. A wallet's best month is usually why you noticed it. Run it in paper mode first, and size for the wallet's ordinary month.
- If a bot's seller shows a leaderboard rank: ask for the months around it. A month at the top proves less than a dull six months in a row. Our scam red flags cover the rest.
- If you build a bot: repeatable beat spectacular here. The kind of wallet that held up made small amounts many times. That is also a reason to test on many trades, not a few good ones.
Whalidate
Verified PartnerCopy trading for Polymarket that checks how a wallet made its money before you follow it. Its WhaleFinder replays each wallet's public history and scores the return on the money put in, the settled trades, the worst…
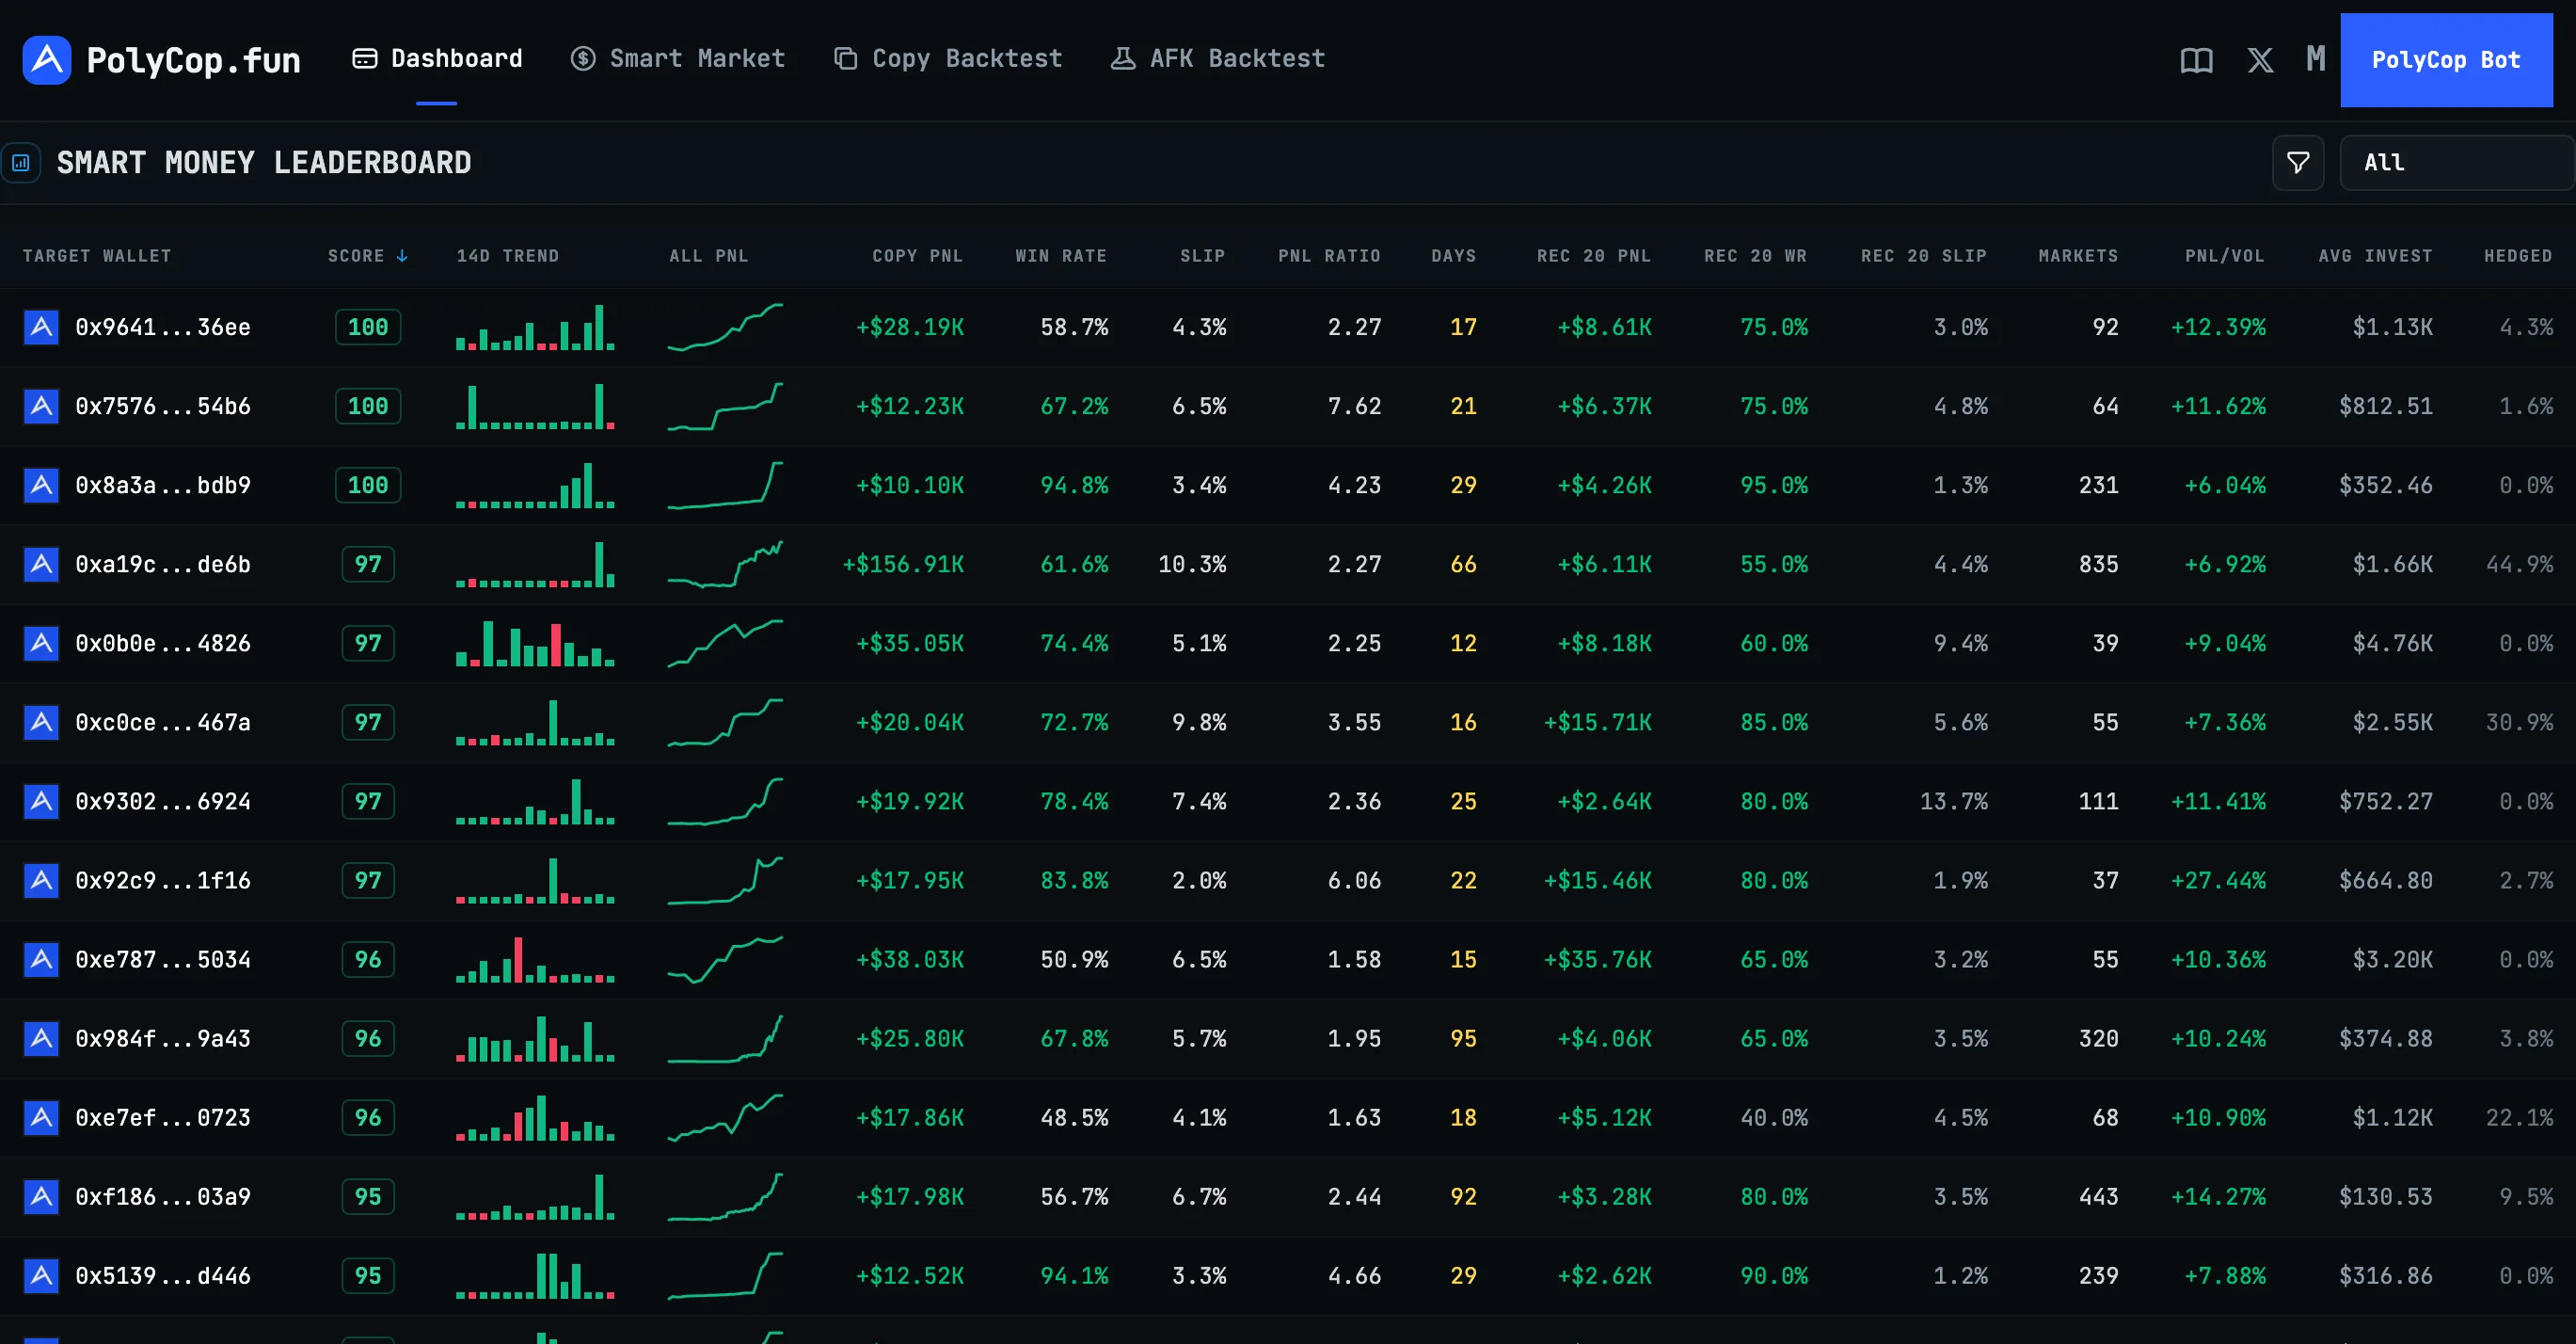
PolyCop
Telegram copy-trading bot with a public smart-money radar behind it. In the bot, Copy Trade mirrors any target wallet's buys and sells under your sizing, price and amount filters, with a sub-wallet per target if you…
How to check a wallet yourself
Every wallet's daily PnL is public:
curl -s "https://data-api.polymarket.com/v2/user-pnl?user=0xWALLET&interval=all&fidelity=1d"Each point has a timestamp and a trade_pnl. Take the difference between two dates to get the profit in between. Then look at the month before and the month after any date you noticed the wallet.
What this test can't tell you
- It is one window. 24 days, from October 12 to November 5, 2026. It holds the US midterms and the middle of the NFL and college football seasons. A different month could look different.
- It is dollars, not returns. We can't see a wallet's capital, so a large wallet counts for more in the totals. The counts of wallets up and down don't have that problem.
- Wallets are only compared with other winners. Every wallet here reached a top-100 board. This says nothing about the average trader.
- Regression is partly arithmetic. Any list chosen by recent results will fall back, even if every wallet has real skill. The fall alone doesn't prove the earlier wins were luck.
- Kinds are from the first day we saw each wallet, and some wallets change how they trade.
Method
- Lists. The 30-day and all-time overall boards from our first snapshot, taken October 11, 2026, and the two Crypto boards added on October 13. Later entrants are wallets first seen from October 14 on, with at least 7 days of data. 514 of our 564 wallets qualified. The other 50 were seen too recently.
- Start of the test. Midnight UTC after the day a wallet was first seen. The end is midnight UTC on November 5, 2026.
- Profit. The change in
trade_pnlbetween two dates, from /v2/user-pnl at daily fidelity, with the same one-day spike filter our wallet pages use. "Didn't trade" means it moved by less than $1. A wallet can move without trading if an open position is revalued, so a few of the small numbers may be that. - Before. The change over the same number of days as the test, ending at the start date.
- Correlations. Spearman rank correlation, with 95% intervals from 2,000 resamples of wallets.
- Kinds. From the reasons recorded in the snapshot that first listed each wallet: market maker, then fast, and human-paced for the rest.
- Script.
scripts/pnl-persistence.mjsin our repository does the pull and prints every table here. It is plain Node with no keys.
Frequently asked questions
- Do top Polymarket traders keep winning?
- About half do, over a few weeks. Of the 100 wallets on the 30-day leaderboard on October 11, 2026, 50 made money in the next 24 days, 38 lost money and 12 didn't trade. 73 did worse than in the 24 days before they were listed. Fast bots held up best: 38 of 47 made money. Human-paced wallets split 42 up and 38 down.
- Does a higher leaderboard rank mean a better trader?
- Not in our test. Among the 88 wallets from the 30-day top 100 that kept trading, the rank correlation between past 30-day profit and the next 24 days was 0.02, with a 95% interval of −0.21 to 0.25. The top 10 went 5 up, 4 down and 1 flat. Ranks 51 to 100 went 23 up, 21 down and 6 flat.
- Should I copy the #1 wallet on the Polymarket leaderboard?
- Rank alone is a poor reason. On October 11 the #1 wallet on the 30-day board, 00gringo00, had made $1.74M in the previous 30 days. It didn't trade in the 24 days after. A wallet can reach the top on one good position, and the board can't tell you whether another is coming.
- What happens to a wallet after it reaches the leaderboard?
- It usually slows down. The 130 wallets that first reached a board between October 14 and October 28 made $13.07M in the days before and $2.59M in the same number of days after. The median wallet went from $36K to $3K. Reaching a board selects for a recent run of luck or skill, and the luck part doesn't repeat.
- Do losing wallets bounce back on Polymarket?
- We can't say. Only 24 active wallets on our lists were down over the 90 days before listing, and 14 of them made money afterwards. That is too few to compare with the 119 of 180 that were up. Wallets on a top-100 board that are down over 90 days are also unusual, so they say little about losers in general.