On this page10 sections
The short answer
Polymarket's leaderboard shows the top of the list. It doesn't stop there, though. It can be paged all the way down, through every wallet that made money, every wallet at zero and every wallet that lost. We paged the 30-day board to its last row and counted.
- 41% made money. 283,936 wallets traded in the 30 days to November 11, 2026. 116,676 were up, 161,441 were down and 5,819 finished at exactly zero.
- Most results are small. The median wallet finished 18 cents down. 48% ended within $10 of zero.
- 3.2% made $1,000 or more. That is 9,053 wallets. 299 made $100,000 or more and 19 made a million.
- The top 100 took 40% of the gains. All winners made $189M together. The top 1,000 made 75% of it.
- Bigger wallets win more often. Wallets that traded a million shares or more were up 56% of the time. Wallets that traded between 1,000 and 10,000 shares were up 37% of the time.
- Reaching the top doesn't settle it. Of the 604 wallets we track that have made a top-100 board, 78 are down over their whole history.
What we counted
The 30-day board had 687,995 rows. They fall into three groups:
| Rows on the 30-day board | Wallets |
|---|---|
| Traded in the 30 days | 283,936 |
| Didn't trade, but have a result | 205,489 |
| Didn't trade, and show zero | 198,570 |
The second group is wallets that placed no order in the window but hold positions from before. Their result is those positions resolving or changing price. 87,110 of them were up and 118,379 were down.
This guide is about the first group: the wallets that traded. A wallet is not a person. One trader can use several, and a bot operator often splits a strategy across many. So "41% of wallets" is close to "41% of traders", and not the same thing.
The last 30 days
| 30-day result | Wallets | Share |
|---|---|---|
| Made $1,000 or more | 9,053 | 3.2% |
| Made $100 to $1,000 | 18,584 | 6.5% |
| Made $10 to $100 | 30,158 | 10.6% |
| Made less than $10 | 58,881 | 20.7% |
| Exactly zero | 5,819 | 2.0% |
| Lost less than $10 | 71,960 | 25.3% |
| Lost $10 to $100 | 52,210 | 18.4% |
| Lost $100 to $1,000 | 26,787 | 9.4% |
| Lost $1,000 or more | 10,484 | 3.7% |
Every row on the losing side is larger than its twin on the winning side. The gap is widest for small results: 52,210 wallets lost $10 to $100, and 30,158 made that much.
The tails are almost even:
| Result | Made at least | Lost at least |
|---|---|---|
| $10,000 | 1,970 | 1,960 |
| $100,000 | 299 | 261 |
| $1,000,000 | 19 | 11 |
So the typical month on Polymarket is a small loss. One wallet in ten made $93 or more. One in ten lost $177 or more. A wallet that made $6,100 was in the top 1%.
Over seven days the split is closer to even. 128,331 wallets traded in the week to November 11: 46% were up and 53% were down. A short window has less time for fees and the spread to add up.
Bigger wallets win more often
The leaderboard also reports each wallet's volume. It is counted in shares, not dollars. A share costs between nothing and $1, so the dollar figure is lower: about half for the large wallets we checked.
| Shares traded in 30 days | Wallets | Up | Median result | Group total |
|---|---|---|---|---|
| Under 100 | 115,874 | 43% | −$0.01 | −$84K |
| 100 to 1,000 | 77,600 | 40% | −$2.91 | −$118K |
| 1,000 to 10,000 | 55,018 | 37% | −$18.56 | −$1.90M |
| 10,000 to 100,000 | 25,998 | 40% | −$90.76 | −$5.38M |
| 100,000 to 1M | 7,903 | 48% | −$135.84 | −$632K |
| 1M to 10M | 1,392 | 56% | +$2,400 | +$13.69M |
| 10M or more | 151 | 60% | +$44,400 | +$8.84M |
The 282,393 wallets that traded less than a million shares lost $8.1M between them. The 1,543 that traded more made $22.5M.
The worst place to be is the middle. A wallet that trades a few thousand shares a month is active enough to pay the spread and the taker fee many times, and too small to earn anything back for quoting. The wallets at the top of the table are mostly software. Our check of the leaderboard found that most of the 30-day top 100 are bots, and the largest of them are market makers that collect the spread everyone else pays.
We saw the same split inside one market type. In a week of Bitcoin 5- and 15-minute windows, 70% of wallets lost, and the wallets that came out ahead were the ones quoting all day.
Size doesn't make a wallet safe. 40% of the 151 largest wallets lost money in the month, and the 11 wallets that lost a million or more are all large ones.
Where the money went
All the winners on the 30-day board made $189.2M. All the losers lost $178.0M.
| Group | Share of all gains | The last wallet in it made |
|---|---|---|
| Top 10 | 12.6% | $1.57M |
| Top 100 | 40.1% | $299K |
| Top 1,000 | 74.7% | $24.2K |
| Top 10,000 | 95.5% | $927 |
The top 1% of winning wallets, 2,038 of them, took 83% of everything won. The other 201,748 winners shared 17%.
Losses are concentrated too, a little less. The 100 worst wallets lost 35% of the total and the 1,000 worst lost 69%. Most of the money on Polymarket moves between a few thousand large wallets. The other 270,000 are trading for tens of dollars.
The two totals don't cancel. Winners made $11.2M more than losers lost, and trading between wallets should come out at zero less fees. Over the 7-day board the sum is −$1.0M. We can't explain the gap from public data, so read the dollar totals as approximate. The counts of wallets don't depend on it.
Even the top 100 aren't all winners
We keep a file on every wallet that has reached a top-100 profit board: overall or Crypto, all-time or 30-day. There are 604 of them now. These are the wallets that copy-trading lists are built from. Here is how they stand over their whole history:
| All-time result | Wallets |
|---|---|
| Up $5M or more | 23 |
| Up $1M to $5M | 101 |
| Up $100K to $1M | 238 |
| Up less than $100K | 156 |
| Exactly zero | 6 |
| Down less than $100K | 31 |
| Down $100K to $1M | 34 |
| Down $1M or more | 13 |
Two more have no all-time row. 518 of the other 602 are up, which is 86%. The 78 that are down have lost $48.2M between them.
A wallet gets onto a 30-day board with one good month. It can do that on a losing record. anoin123 made $185K in the last 30 days and is down $4.86M all-time. GoalLineGhost made $406K in the month and is down $2.39M. Both were once ahead by more than $1.7M.
| Wallets that reached | Count | Up all-time |
|---|---|---|
| The all-time top 100 | 106 | 106 |
| The 30-day top 100 | 260 | 205 |
| The Crypto all-time top 100 | 103 | 100 |
| The Crypto 30-day top 100 | 201 | 167 |
One wallet in five that has reached the 30-day top 100 is at or below zero overall. Our list of top traders losing overall names them.
Being up all-time doesn't mean a wallet is winning now. Our checks sort the 604 by what is wrong with them as something to copy, and each has its own page:
| Check the wallet fails | Wallets | Up all-time |
|---|---|---|
| Stopped trading | 217 | 92% |
| Speed trader | 232 | 84% |
| Market maker | 215 | 84% |
| One big win: half or more of the profit from one market | 166 | 100% |
| Too few markets: under 30 | 112 | 89% |
| Not winning lately: flat or down over 90 days | 208 | 79% |
| Buys both sides | 37 | 97% |
A wallet can fail several checks, so the rows overlap. Three things stand out:
- The safest-looking group has stopped. 217 wallets haven't traded in two weeks or more, and 92% of them are up. Many won once on a big event and left. Their profit is real and there is nothing to follow.
- 166 records rest on one market. For these, a single market is half or more of everything the wallet ever made.
- Recent results are weaker than the totals. 387 of the 604 are still trading. 320 of them are up all-time, 325 are up over 90 days and 312 are up on the 30-day board. Only 249 are up on all three. Take out the one-market and thin records and 167 are left.
So of the 604 wallets that have reached the top of Polymarket, 167 are trading now, up on every window we measure and have a record wide enough to mean something. That is fewer than three in ten. The copy-trading study and the frozen-leaderboard test look at what happens when you follow them.
What this means for a bot
- A profitable month proves little. Four wallets in ten have one. A seller who shows one good month is showing something close to a coin flip. Ask for the wallet address and look at 90 days and the all-time row.
- $1,000 a month is a top-3% result. Any bot that promises it is promising to beat 97% of the wallets that traded. That can be true. It needs a wallet you can check, and our red-flag list covers what to ask for.
- The money is made at size and on the book. The groups that came out ahead traded a million shares or more, and most of the largest are market makers. A small bot that takes liquidity is in the group that lost.
- Don't pick a wallet to copy by its rank. One in five wallets from the 30-day top 100 is down overall, and a third of the whole set has stopped trading. Copy-trading bots follow whatever address you give them, so the choice of wallet is the whole result.
- Count your own fees. The gap between 41% up and 57% down is about what fees and the spread take from a group that would otherwise split evenly. What a bot really costs adds them up.
Whalidate
Verified PartnerCopy trading for Polymarket that checks how a wallet made its money before you follow it. Its WhaleFinder replays each wallet's public history and scores the return on the money put in, the settled trades, the worst…
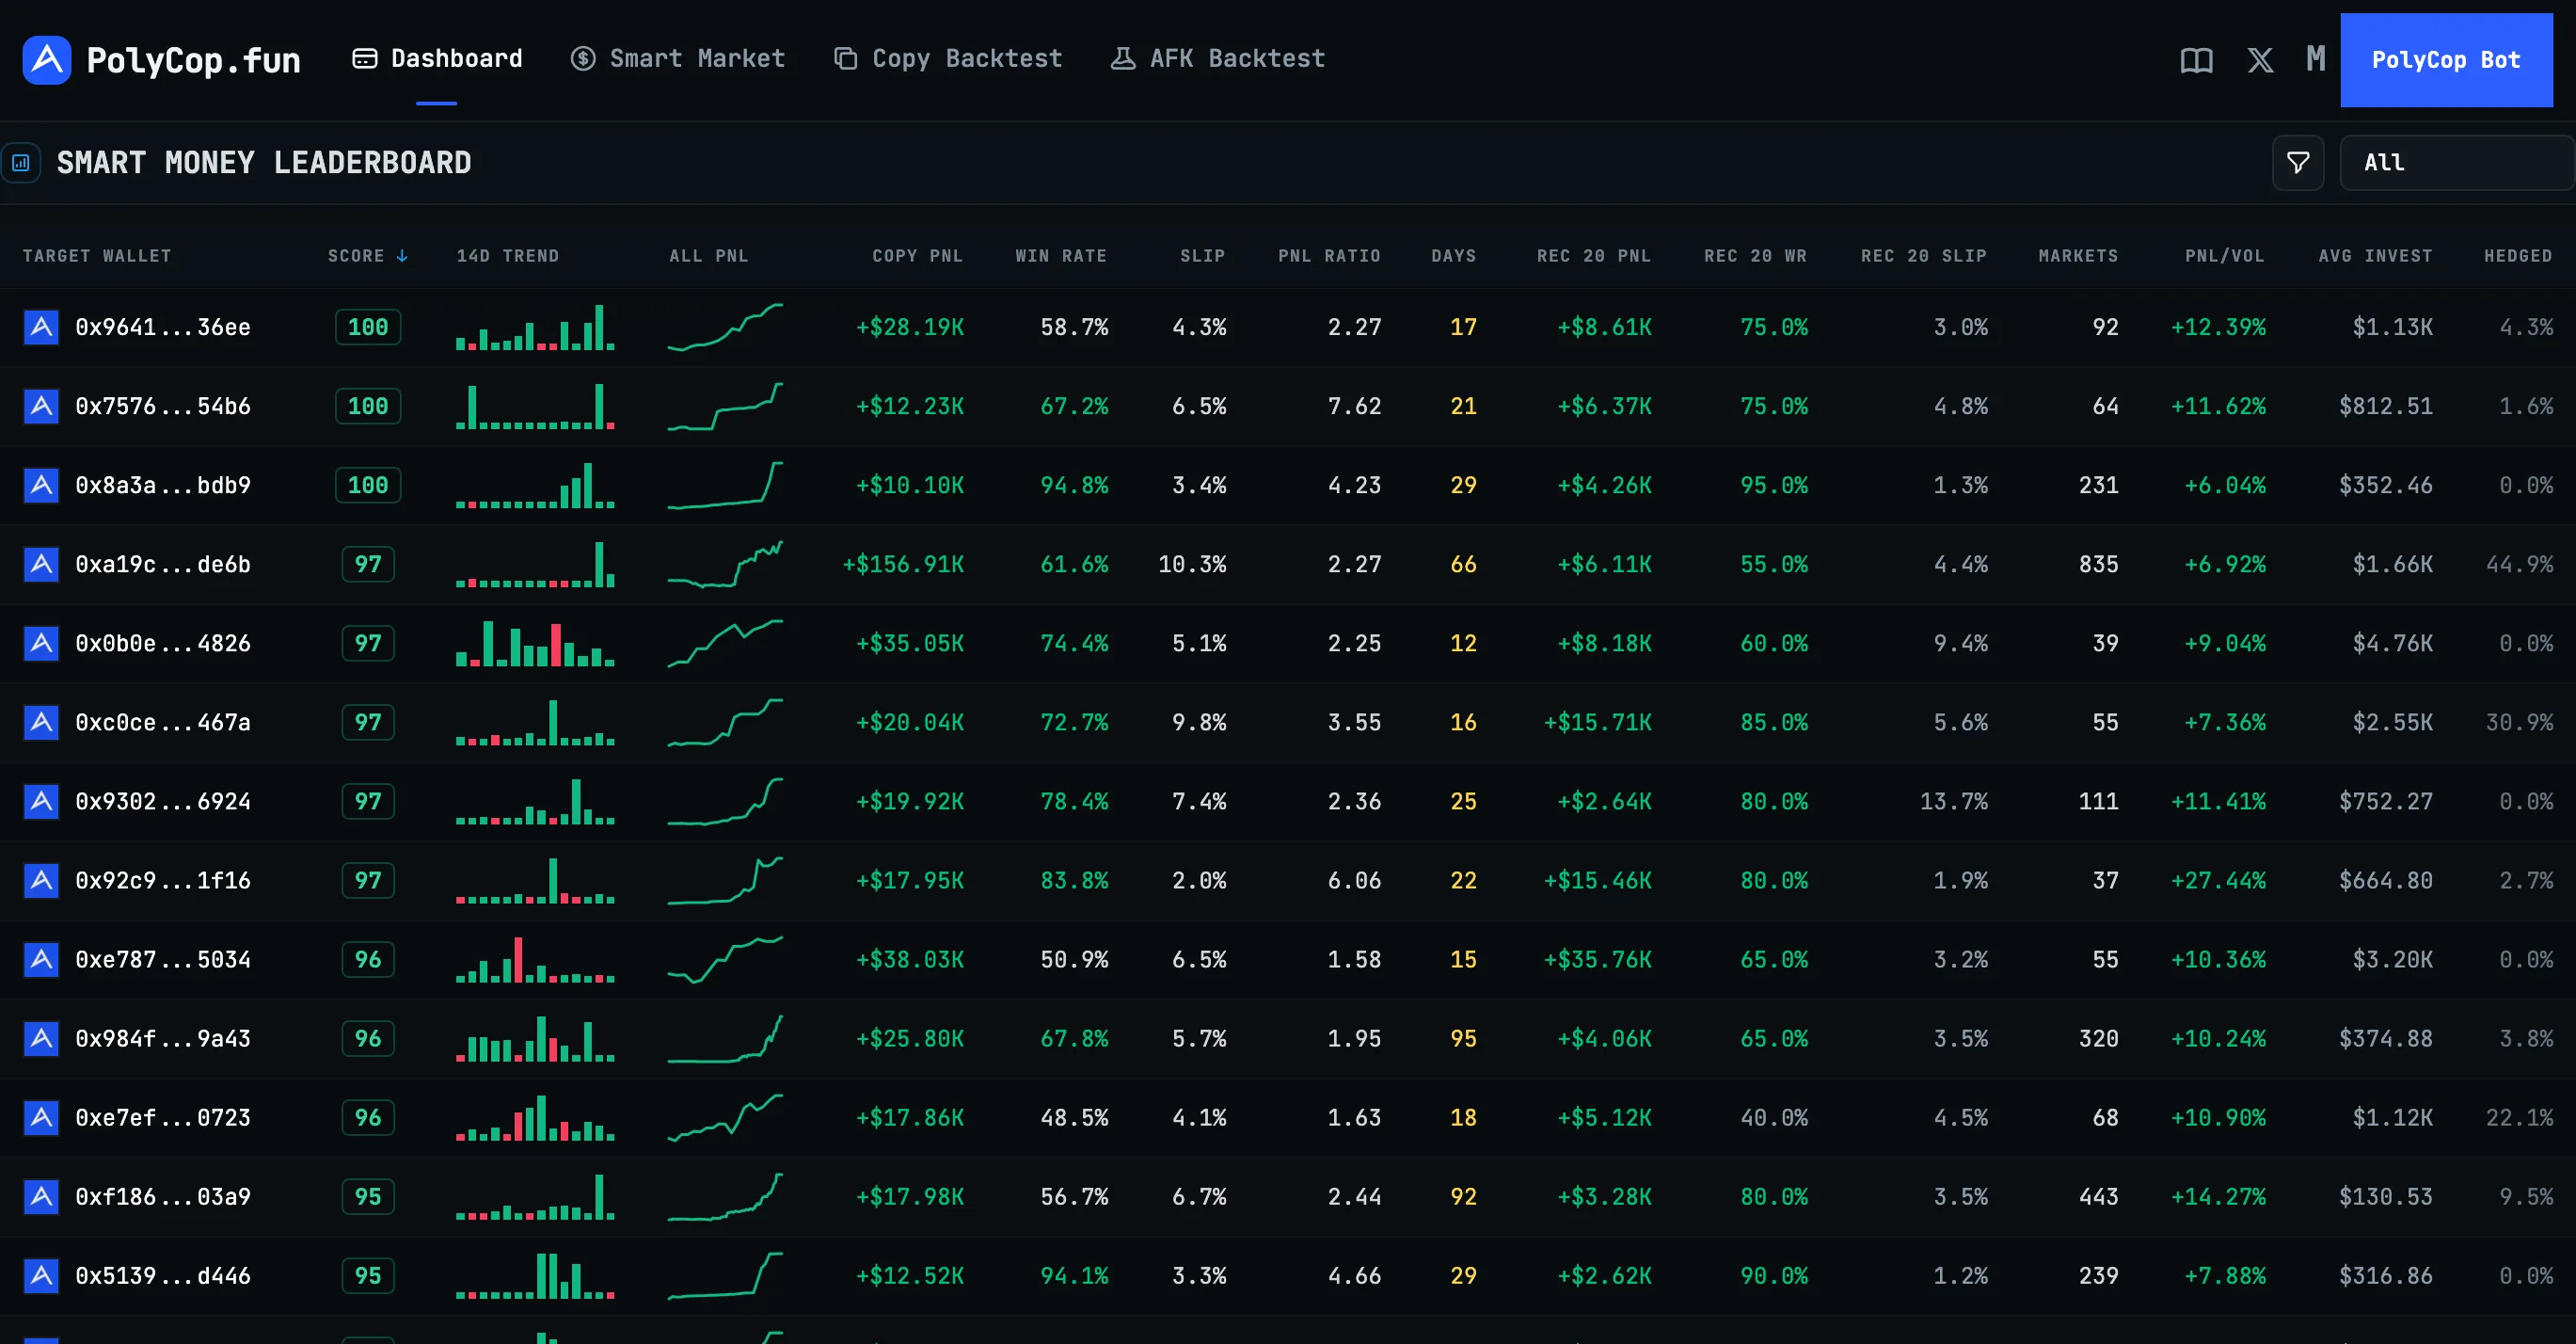
PolyCop
Telegram copy-trading bot with a public smart-money radar behind it. In the bot, Copy Trade mirrors any target wallet's buys and sells under your sizing, price and amount filters, with a sub-wallet per target if you…
Poly-Maker
Open-source market-making bot for Polymarket. Quotes both sides of the book over WebSockets with configurable spreads, position merging and risk controls.
How to count it yourself
The leaderboard is one public route. Ask for a page of 1,000 rows, sorted by profit:
curl -s "https://data-api.polymarket.com/v2/leaderboard?time_period=month&category=overall&sort_by=PNL&limit=1000"Each row has rank, user_id, pnl and volume. The response ends with pagination.next_cursor. Pass it back as cursor for the next page and repeat until has_more is false. The 30-day board took 688 requests and under four minutes. Use time_period=week for the 7-day board. time_period=all works the same way and is several times longer.
To see where one wallet stands:
curl -s "https://data-api.polymarket.com/v2/leaderboard?user=0xWALLET&time_period=month"That returns its profit, its volume and rank_pnl. Compare the rank with the tables above.
What this can't tell you
- Wallets, not people. We can't join a trader's wallets together, or split a bot farm into its owner.
- Profit is before rebates. Makers are paid rebates and rewards on top of the leaderboard figure. That lifts the largest wallets further and changes nothing for small ones.
- No all-time figure yet. The all-time board runs to well over a million rows and our pull of it was still going when this was written. The all-time numbers here are for the 604 tracked wallets only.
- One month. The 30 days to November 11, 2026 include the US midterm elections, where favourites mostly held. A month without a big event could split differently.
- No capital. The board shows dollars won or lost, not the money behind them. A $100 gain is a great month on $200 and a poor one on $50,000.
- Volume is in shares. The size bands are a rough order of size, not dollar turnover.
- The totals don't cancel. As noted above, gains and losses on the board differ by more than fees explain.
- The tracked 604 are winners by selection. Each one reached a top-100 board at least once. They say nothing about a typical wallet. The full board does that.
Method
- Boards. /v2/leaderboard with
sort_by=PNL,category=overallandlimit=1000, followingnext_cursorto the last row. 30 days: 687,995 rows. 7 days: 549,115 rows. - Traded. A row counts as having traded when its
volumeis above zero. All shares and medians are over those rows unless the text says otherwise. - Up and down.
pnlabove or below zero, rounded to the cent. - Shares of gains. Each group's summed
pnlover the sum for all rows withpnlabove zero, including rows without volume. The same for losses. - Tracked wallets. The 604 wallets in our wallet set on November 11, 2026, 12:52 UTC, with the checks described on each wallet page. All-time profit is the wallet's all-time leaderboard row.
- Script.
scripts/pnl-distribution.mjsin our repository does the pull, and--reportprints every number in this guide. It is plain Node with no keys.
Frequently asked questions
- What percentage of Polymarket traders make money?
- About 41% in a month. Of the 283,936 wallets that traded on Polymarket in the 30 days to November 11, 2026, 116,676 made money, 161,441 lost and 5,819 finished at exactly zero.
- How much does the average Polymarket trader make?
- Almost nothing either way. The median wallet that traded in the 30 days to November 11, 2026 finished 18 cents down, and 48% of wallets ended within $10 of zero. One wallet in ten made $93 or more, and one in ten lost $177 or more.
- How many Polymarket traders make $1,000 a month?
- About 3 in 100. In the 30 days to November 11, 2026, 9,053 of the 283,936 wallets that traded made $1,000 or more. 1,970 made $10,000 or more, 299 made $100,000 or more and 19 made a million. Losses were about the same size: 10,484 wallets lost $1,000 or more.
- Who makes most of the money on Polymarket?
- A few hundred wallets. All the winners on the 30-day leaderboard made $189M together, and the top 100 made 40% of it. The top 1,000 made 75%. Wallets that traded a million shares or more were up 56% of the time, against 37–43% for wallets that traded less than 10,000.
- Are the top traders on the Polymarket leaderboard all profitable?
- No. Of the 604 wallets we track that have reached a top-100 profit board, 78 are down over their whole history, by $48M in total, and 13 of those have lost more than $1M each. One wallet in five that has reached the 30-day top 100 is at or below zero all-time.